|
|


| |

June 2016 SEE Monthly Update
Sand & Proppant Companies Squeeze Through Decline Funnel
The most recent global oil supply-demand news is mixed: demand has increased in India; the continued weak dollar heralds higher oil prices; Canadian oil sands production shut down due to fires is reopening; Libyan production is lower; US production has fallen 1 million barrels per day (MMBPD) below its level of a year ago; insurgents in Nigeria announced their intent to destroy all of that country's oil production; and oil service companies have pulled out of Venezuela because they are not being paid.
The expected loss of 1 MMBPD from Nigeria alone in May would appear to start resolving the 1.4 MMBPD of daily oversupply. But meanwhile, Saudi Arabia and Iran are producing all-out to grab market share. Recent Saudi oil pricing changes have been strategic: slightly lower in Europe, higher in the US and Asia.
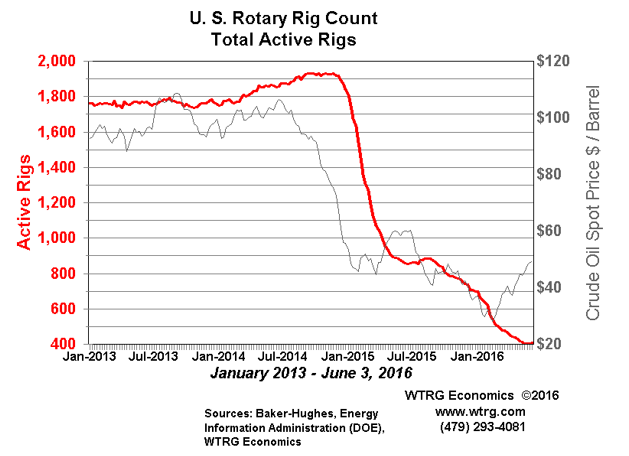
The graph above shows the lagged correlation between oil price and US rig count, with a temporary divergence only in the last few months. This SEE detailed analysis considers one of the key oil service sectors: sand and proppants.
For more on this topic log in now or, if you are not already a subscriber, subscribe now.
Copyright 2016, Starks Energy Economics, LLC. This information may not be disclosed, copied or disseminated, in whole or in part, without the prior written permission of Starks Energy Economics, LLC. This communication is based on information which Starks Energy Economics, LLC believes is reliable. However, Starks Energy Economics, LLC does not represent or warrant its accuracy. This communication should not be considered as an offer or solicitation to buy or sell any securities.

- Sand & Proppant Companies Squeeze Through Decline Funnel, June 2016
- Gulf Coast (PADD III) Refining, May 2016
- California Refining, April 2016
- Low Natural Gas Prices Benefit Utilities, March 2016
- Do Solar Energy Companies Shine?, February 2016
- Oil Export/Energy Bill Winners and Losers, January 2016
- Permian Persistence, Part II, December 2015
- Permian Persistence, Part I, November 2015
- Life at the Pumps: Gasoline Demand-Analysis in Two Graphs, October 2015
- Whale Watch: Dividend Hunting at Integrated Internationals, Late September/Early October 2015
- Enduring the Downturn; Bakken Resilience - August 2015
- California Refiners - July 2015
- Bakken Producers, US vs. OPEC vs. Russia, Epstein book - June 2015
- Investor Momentum, Oklahoma Earthquakes, Bakken Rail Transport - May 2015
- Regulatory Changes, Earthquakes, and Proppant Companies - April 2015
- Who is Hurt and Who Benefits from the Oil Price Drop? - March 2015
- Oil Field Services Stress Tested - February 2015
- Haynesville, Louisiana Dry Natural Gas Field - January 2015
- Is the Permian a Bargain Basin Yet? - December 2014
- Starks Energy Economics on Natural Gas - 4th quarter 2014
- Eagle Ford Energy - 3rd quarter 2014
- The Power of the Permian - 2nd quarter 2014
- Ethylene, Star Petrochemical with Renewed Luster - 1st quarter 2014
- Pipeline Drag Reducers - 4th quarter 2013/1st quarter 2014
- Signal vs. Noise: Energy Sources Fueling the United States Now - 3rd quarter 2013
- Natural Gas: Heating, Electricity, Industrial Use, Transport Fuel, Export, or All of the Above? - 2nd quarter 2013
- Besides Better Weather, What Does It Take to Operate an Oil Refinery on the US East Coast? - 1st quarter 2013
- Oil Industry in North Dakota Continues Booming - 4th quarter 2012
- Low First-Half Natural Gas Prices Help Clean the Air - 3rd quarter 2012
- Permian Basin, West Texas and New Mexico - 2nd quarter 2012
- US MidContinent Refineries - 1st quarter 2012
- North Dakota's Bakken Oil Shale Production - 4th quarter 2011

sitemap | home | contact us | bio | links | events
|
|
|